

It's pretty common to not fully capture how Sales Engineers spend their time. Not to encourage micromanagement, but if you don't know how they're spending their time, how can you know how to adjust your processes or KPIs?
Short of tracking every activity, start by surveying your team to uncover how many hours per week
they think they spend on activities X, Y, or Z. To get you started, here's a list of possible activities
to include in your survey:
- Discovery
- Technical Demos
- POCs
- Consulting Calls
- Repetitive “Micro Demos”
- Repetitive Standard “Qualifying Demos”
- Repetitive FAQ and Closing Demos
- Improving Product Knowledge
- Planning and Architecting Solutions
- RFPs
- Training and Mentoring
- Customer Support
You can also refer to our to see what 1000+ survey respondents reported on how they spend their time vs. what they determine are the highest value engagements. Find out more here!
When you evaluate at the individual level where SEs spend time (and across the teams they support, including CS, Marketing and BD), it’s easy to see why SEs get overloaded. It’s also apparent that your SEs are arguably your GTM strategy’s most valuable resources.
POCs are rising in significance.
POCs have climbed in their ranking since 2023 due to their impact on moving the needle. In particular, Leaders view POCs as being more valuable to driving outcomes compared to ICs.
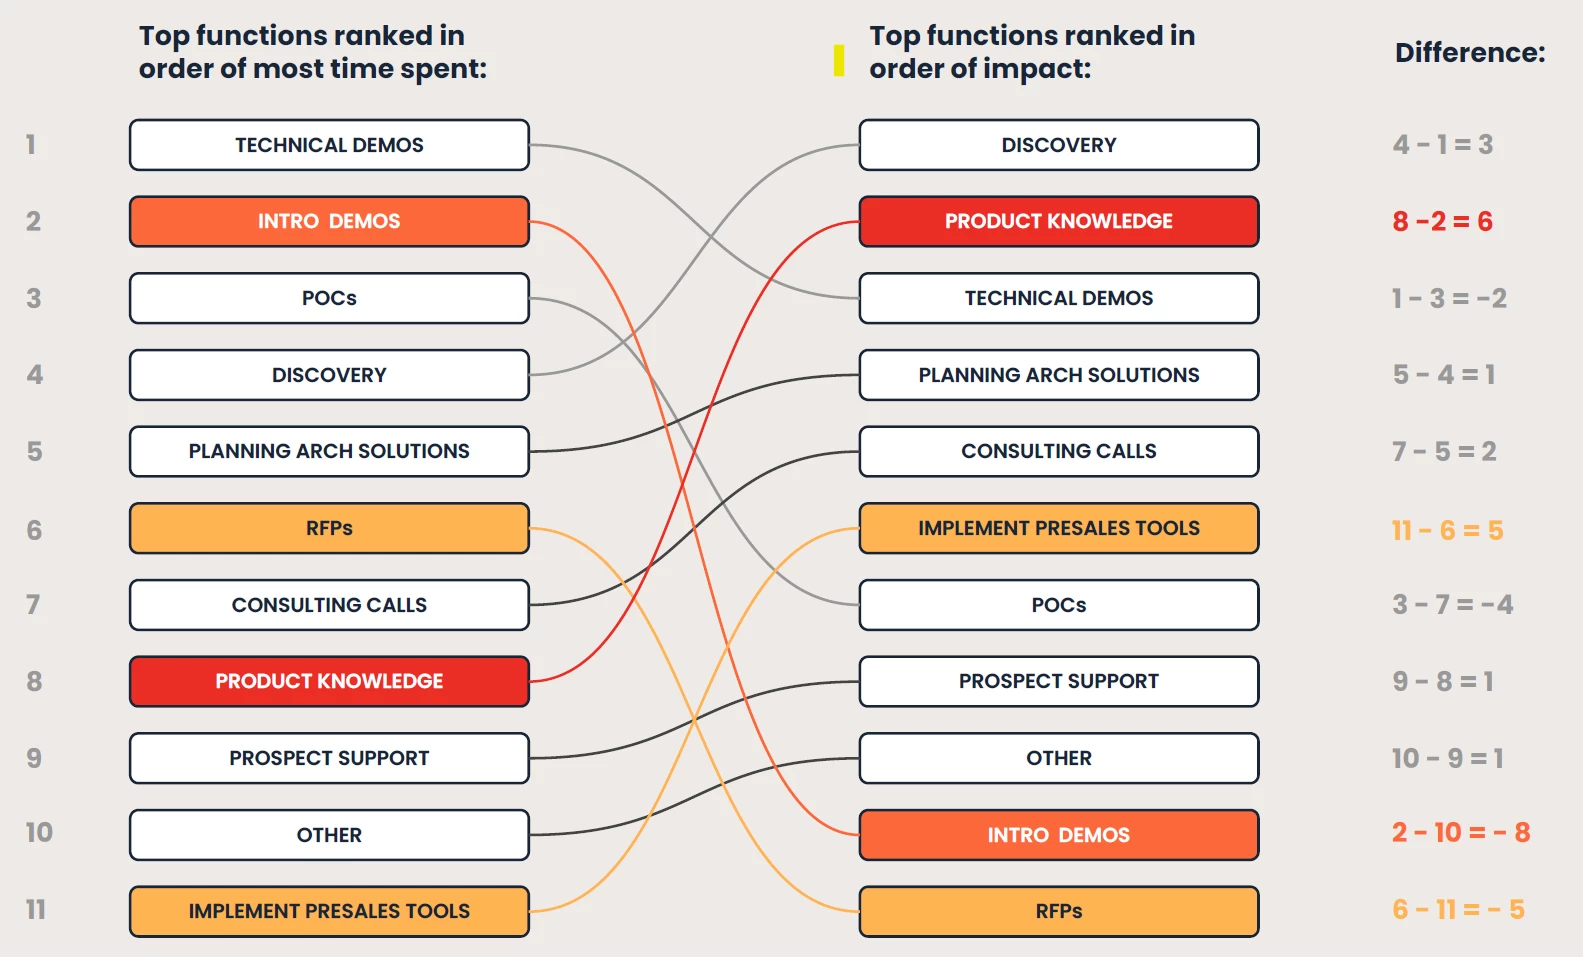
Like last year, the inverse is true for Intro Demos and RFPs — both consume more time than respondents feel is warranted. Intro Demos exhibit the greatest disparity, being the second most time-consuming activity but only 10th in perceived impact. ICs also report spending more time doing RFPs than Leaders think they do. This data suggests that Intro Demos and RFPs are prime candidates for automation.
Misallocation is worsening YoY.
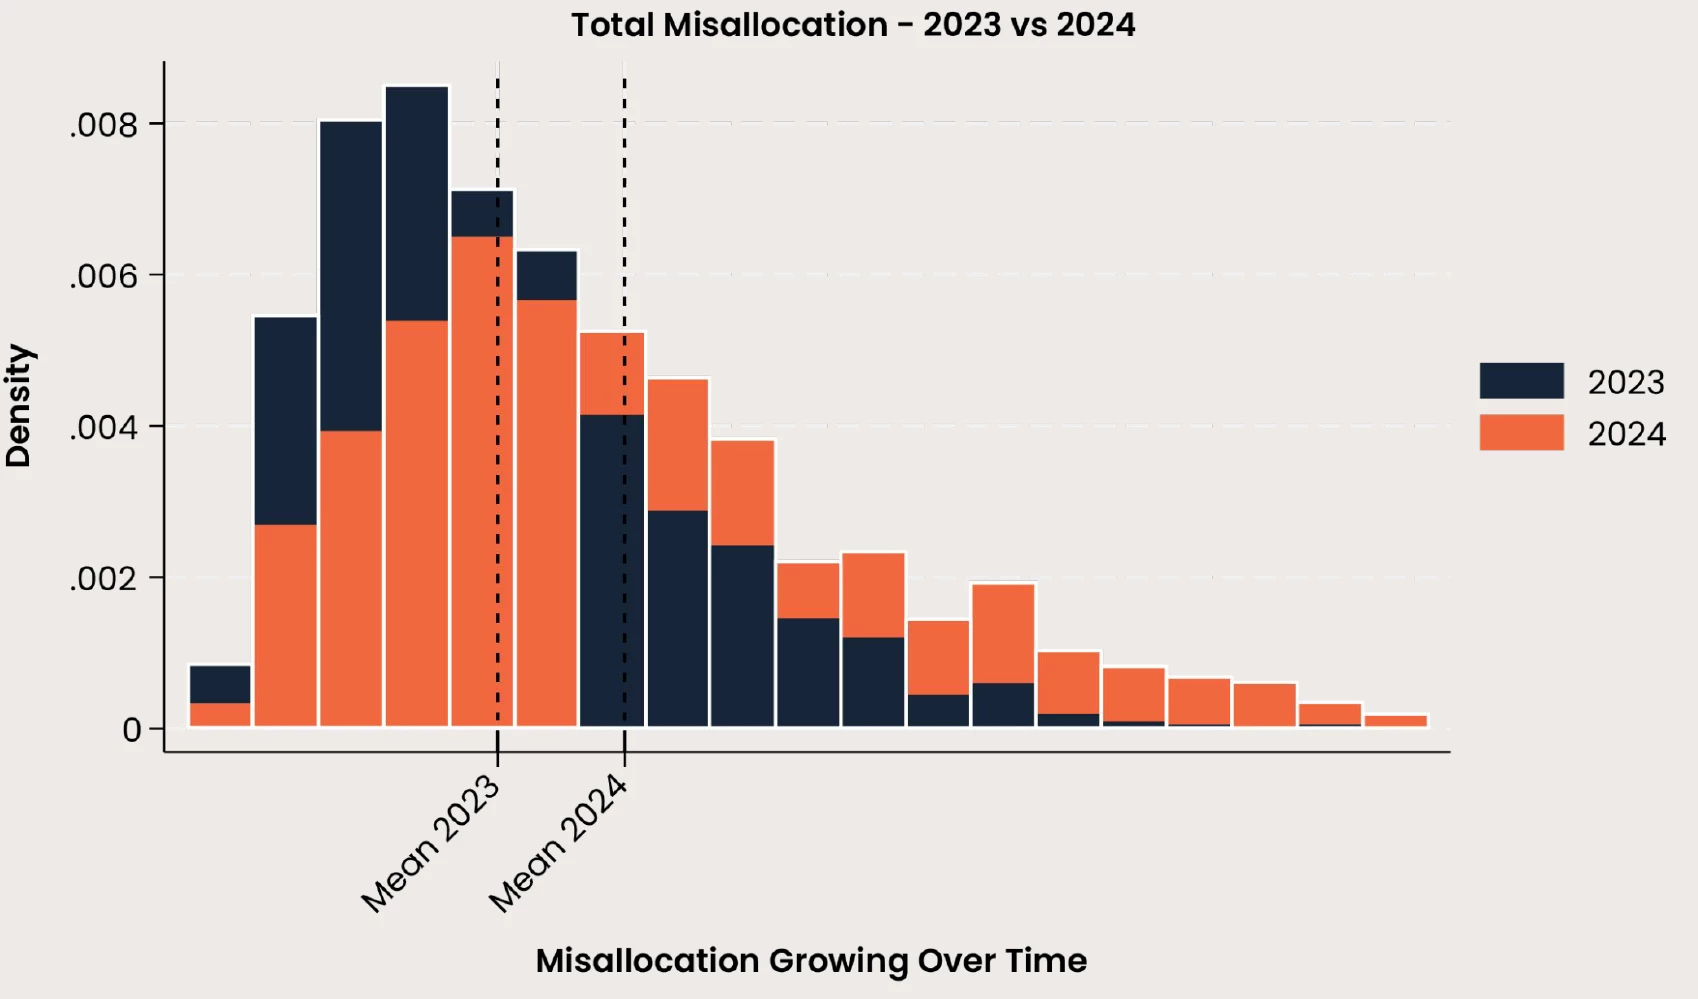
Despite SEs dedicating more time to high-impact activities like Discovery, misallocation has worsened from 2023 to 2024, indicating that even targeted efforts have yet to fully optimize the balance of task prioritization across Presales functions. Over 50% of this increase in misallocation is driven by greater misallocations in Intro Demos, RFPs, and Discovery.
The misallocation of presales resources places strain on the entire buyer's journey. Teams from marketing to sales to customer success all have a need to simplify activities the buying process and scale product expertise across the funnel.
So what is the best use of the SE’s time?
What are the activities that have the biggest material impact on outcomes?
The answer might have some uniqueness in your organization, but assume these are directionally aligned to what respondents said. If so, you’d want them spending as much time as possible on:
- Discovery
- Planning and Architecting Solutions
- Improving Product Knowledge
- Technical Demos
- POCs
- Consulting Calls
Once you know the split between actual and ideal, set achievable improvement goals. If you could, for example, refocus 80% of SE time to the high impact activities above, how much would that change outcomes at your organization? The reality is most SEs are dragged into things that do not lean into what they’re uniquely trained and skilled at doing. What can you help them offload and what can you reasonably help them ramp up?
Once you know what your SEs are spending their time on, you’re ready to look for opportunities. Let’s take a look at how using a spreadsheet can help.
https://goconsensus.com/research/free-key-activity-gap-analysis-worksheet/
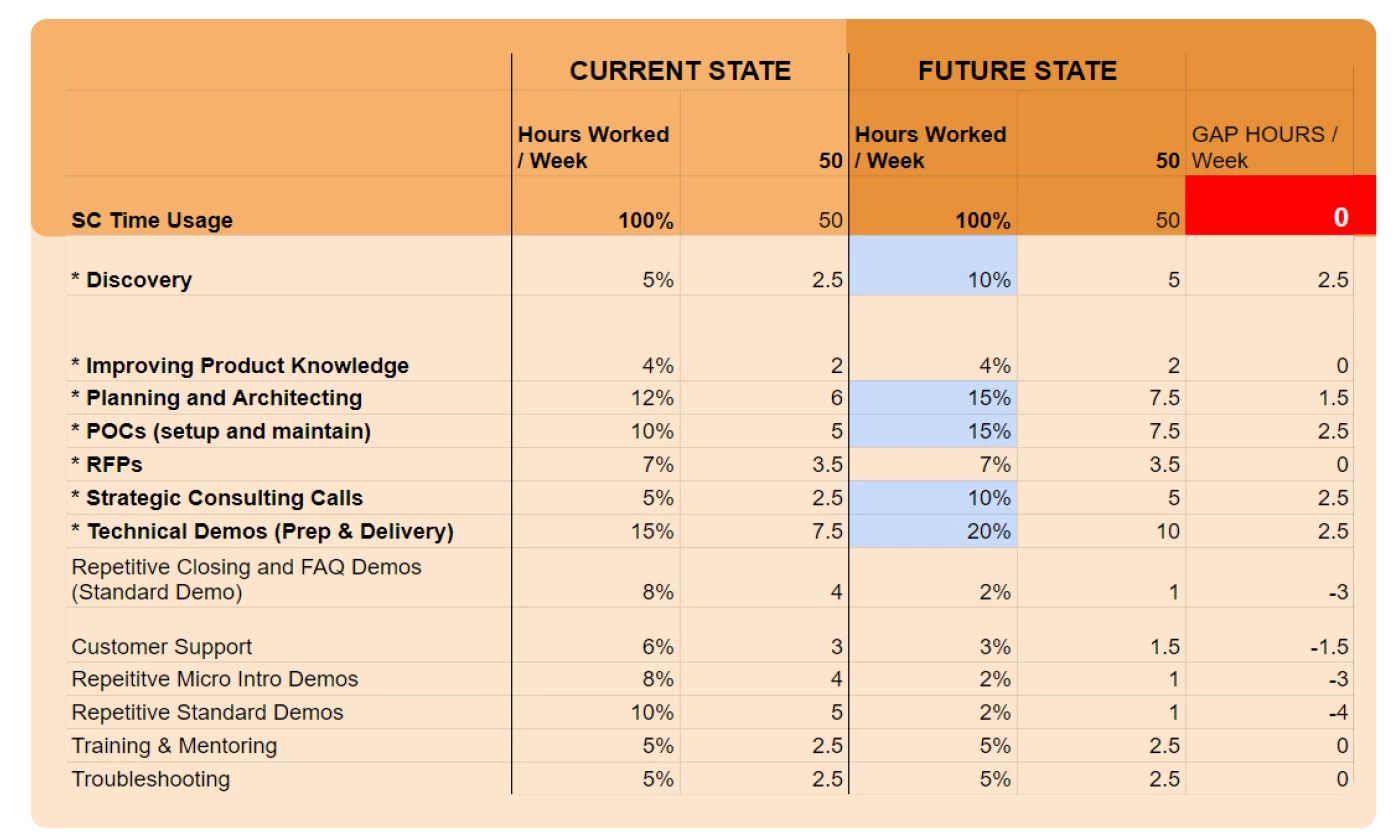
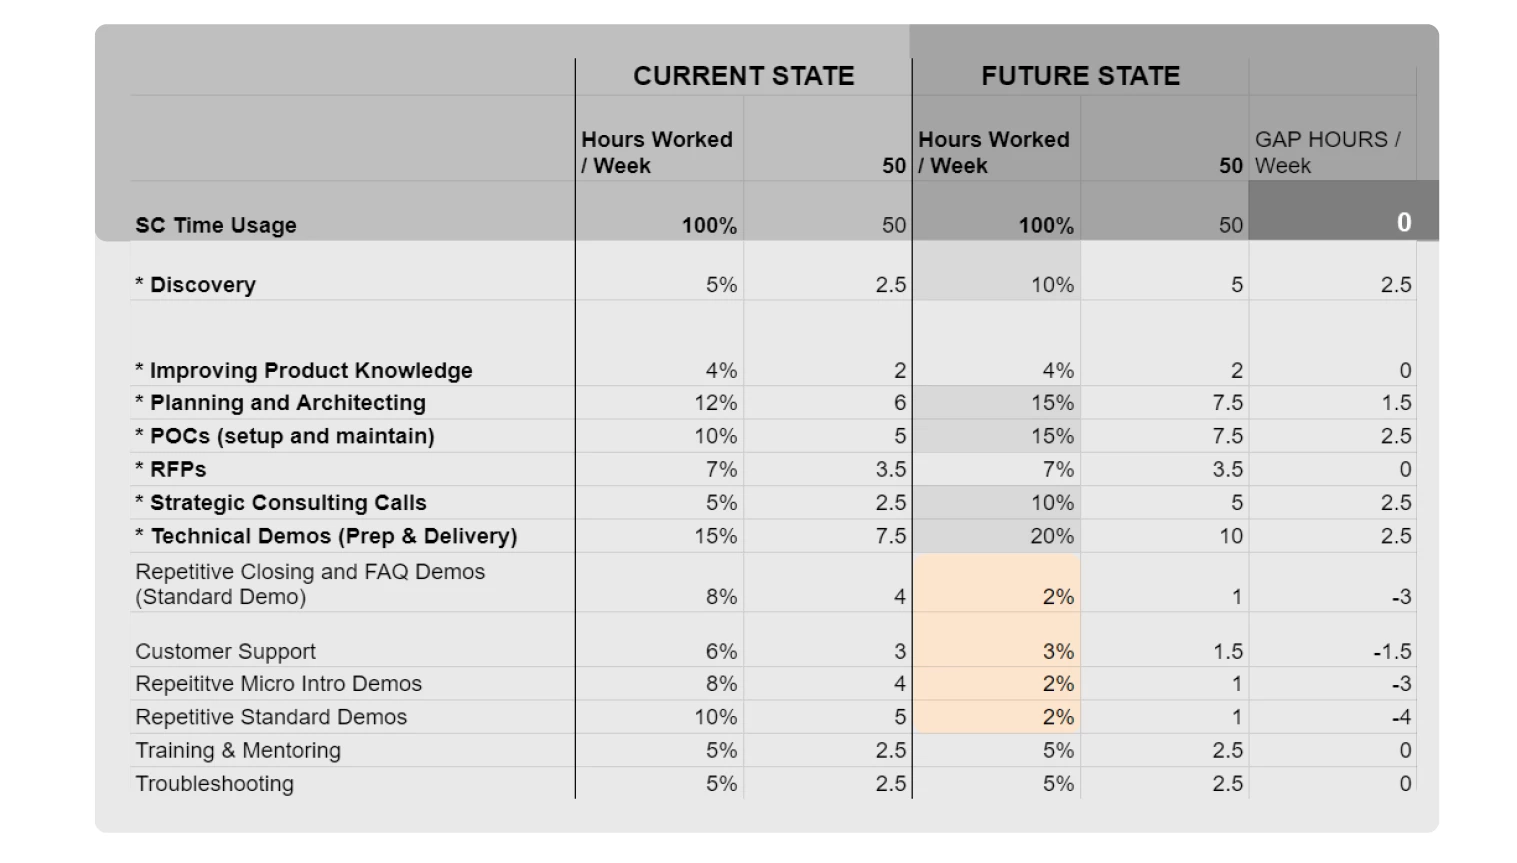
Look at the first two columns in the spreadsheet shown above. What we're doing here is listing out the different activities and the percentage of time spent on each activity. We’re assuming a 50 hour work week in this example. The activities with asterisks are the ones that we want them to spend more time on. If we can somehow offload some of these other things and have them spend more time in here then we can increase our output on these key activities and handle increased demand. The table cell in blue shows the desired increase. You can see that we would need to save 11.5 hours of time per week (red cell) to increase the time spent on key activities.
Another broad way to look at this is that they are spending 58% of their time on key activities today and we want to increase their key activities to 81% of their time.
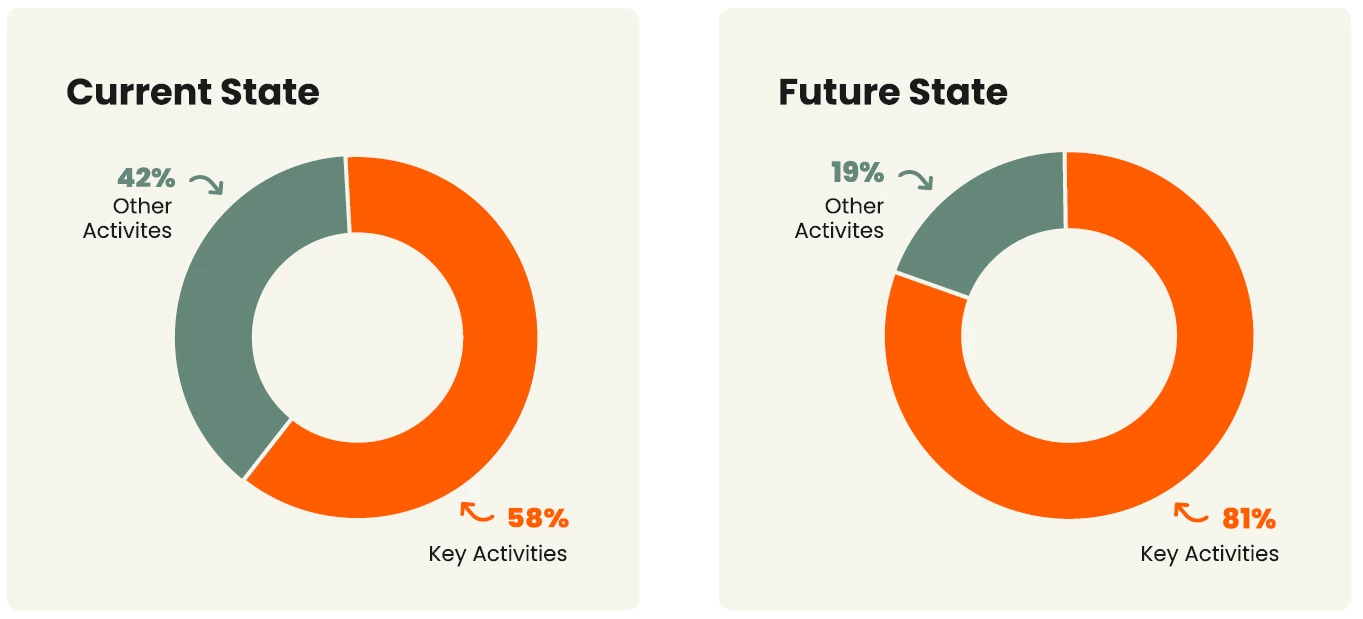
To increase their time on key activities to 81%, we need to decrease the amount of time they spend on non-key activities. In this example, we’ll decrease their time spent on repetitive demos and customer support:
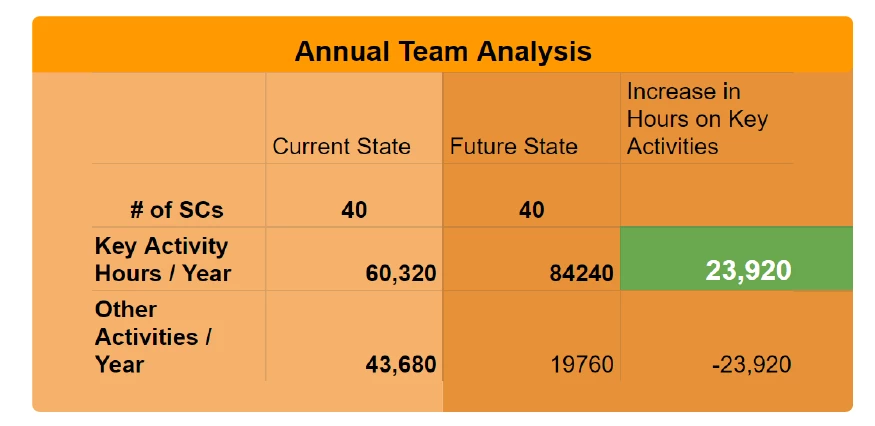
By increasing key activities and decreasing time spent on repetitive demos, we save 11.5 hours per week per SE. Across an entire team of 40 SEs, that is 23,920 hours per year. This begs the question: how can we get them to spend so much less time on repetitive demos so we can gain the increase in key activities?
Find out more about how to raise the efficiency of your Sales and Presales teams here!