

What do the different colors represent in the heatmaps section?
As prospects view the demoboards, the Consensus Platform will track their viewing data and display it using a Heatmap.
There are multiple colors representing how many times a viewer watched a specific section of the demo.
The following images will help explain the differences:
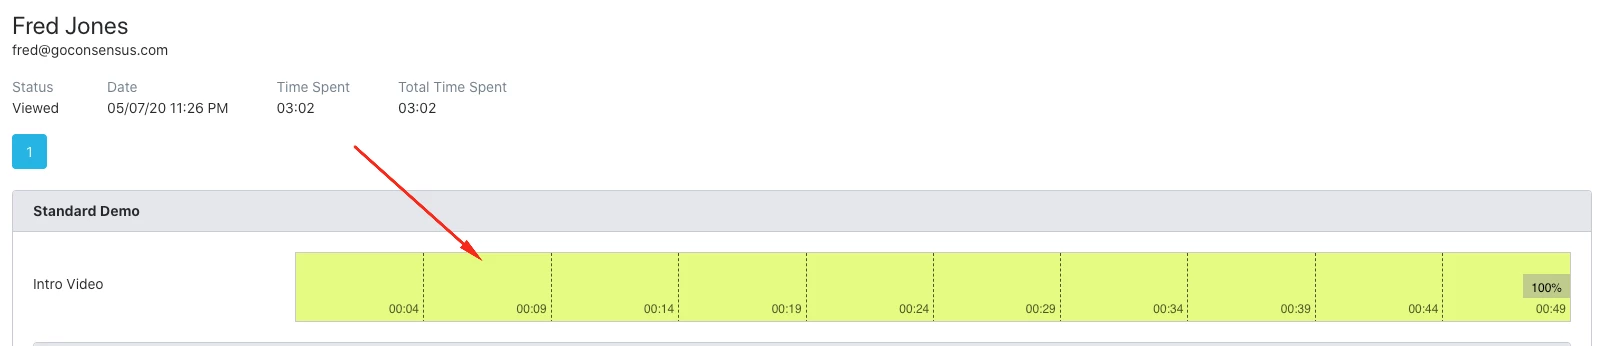
Light Green represents 1 view:
Light Yellow represents 2 views:
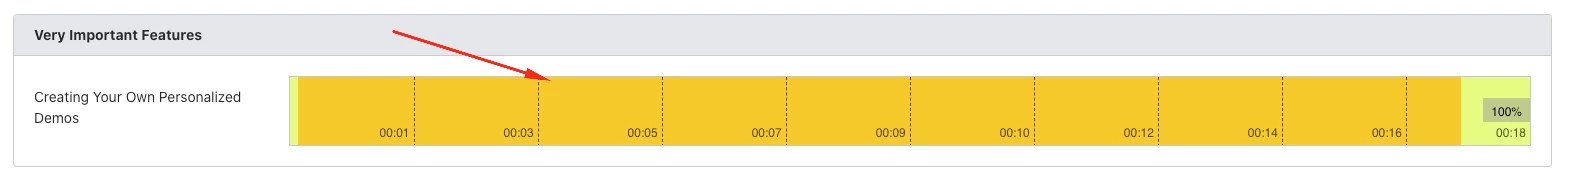
Dark Yellow represents 3 views:
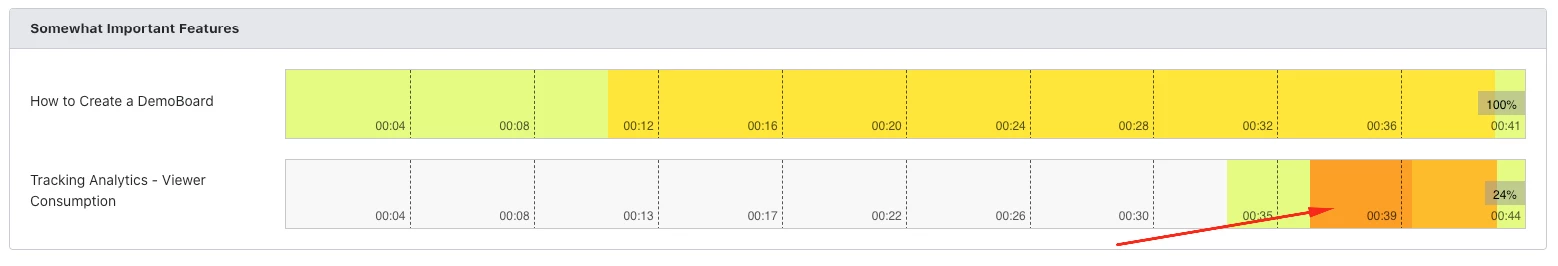
Any sections with no color represent portions of the video that the viewer skipped
It’s important to understand and consult this heatmap prior to meeting with a prospect. This data can be used to structure upcoming agendas and will ensure you’re focusing on the most important features/solutions for your clients.